Boosting Performance: How We Optimized Startup Time for the Jar App by 45%
12 min read · Written by Soumen Paul
Imagine this: you’re excited to open your favorite savings app, JAR, but as soon as you tap the icon, you're greeted with a loading screen that feels just a little too long. Sound familiar? Now, picture this instead—lightning-fast startup, seamless transitions, and an app that’s
Imagine this: you’re excited to open your favorite savings app, JAR, but as soon as you tap the icon, you're greeted with a loading screen that feels just a little too long. Sound familiar?
Now, picture this instead—lightning-fast startup, seamless transitions, and an app that’s ready to go before you can even blink.
We’ve been hard at work behind the scenes, fine-tuning every detail to make JAR not just better, but faster. And today, we’re thrilled to share the results of our efforts. Check out this video comparison and states below to see the dramatic difference between our old startup time and the new, optimized version. It’s more than just a few seconds shaved off; it’s a transformation that changes the way you experience JAR.

This comparison video is based on the Samsung A35, a relatively high-end device. The results are even more pronounced and noticeable on lower-end devices, as highlighted in the statistics below.
Ready to dive into how we achieved this speed boost? Let’s break down the strategies and techniques that turned this dream into reality. From optimizing model-building logic to threading magic, we’ve got all the insider details right here.
Improvements in glance -
- Baseline profiles and Benchmarking
- DEX optimisation
- Tracking through firebase custom traces
- Metrics Manager - Using crash analytics non fatals to record wherever it is greater than x and split of different fragment metrics
- Optimizing Application class
- Wrapping UI Components with View Stubs and reducing initial overhead of View Pager to load our bottom nav fragments.
- Preparsing Splash lottie
- Prefetching home page data
- Using async in epoxy and ensuring nothing breaks in this (remote config)
- Calculation of frame freezing time
Baseline Profiles - (Why and How) - Reduced startup time metric by 15%
When you first launch an app, the Android Runtime (ART) interprets the app's bytecode, which can cause initial delays. As you use the app, ART's Just-In-Time (JIT) compiler identifies frequently used code paths and compiles them into native machine code for faster execution, reducing future load times.
While it initially relied heavily on Ahead-of-Time (AOT) compilation, modern Android versions incorporate a Just-In-Time (JIT) compiler for further performance optimizations. This hybrid approach combines the benefits of both worlds, providing faster app startup times.
Can we optimize it further and avoid this initial interpretation and JIT pre compilation overhead during runtime supported by developer’s decided path flow?
YES! We can. Here we welcome Baseline Profiles.
What does it do?
The pre-compilation of bytecode into machine code for specified profiling data in a Baseline Profiler happens during app installation, not at launch time. This is a key difference between Baseline Profiler and Just-in-Time (JIT) compilation.
Here we as developers have an upper hand in deciding these flows which you want to be pre-compiled over Android’s ART.
Working Implementation
Make a new baseline generator module. It will already have some prebuilt code like some test probes for startup written on it. Then we need to generate a profile file which will have all the instructions of pre compilation of byte code to machine code.
We can do it by running a specific gradle terminal code into the studio terminal or we can also run the collectBaselineTest. But we would not be applying minification and obfuscation on it. As we don't want to obfuscate the profile file before we install it with apk. So it's a more of like a new variant of release with a profile file which is not minified and obfuscated.
It basically sets the enablerules = BaselineProfile
This means it will only generate the profile file and will do nothing with a special release variant of the project. Better to have a separate proguard file for baselines.
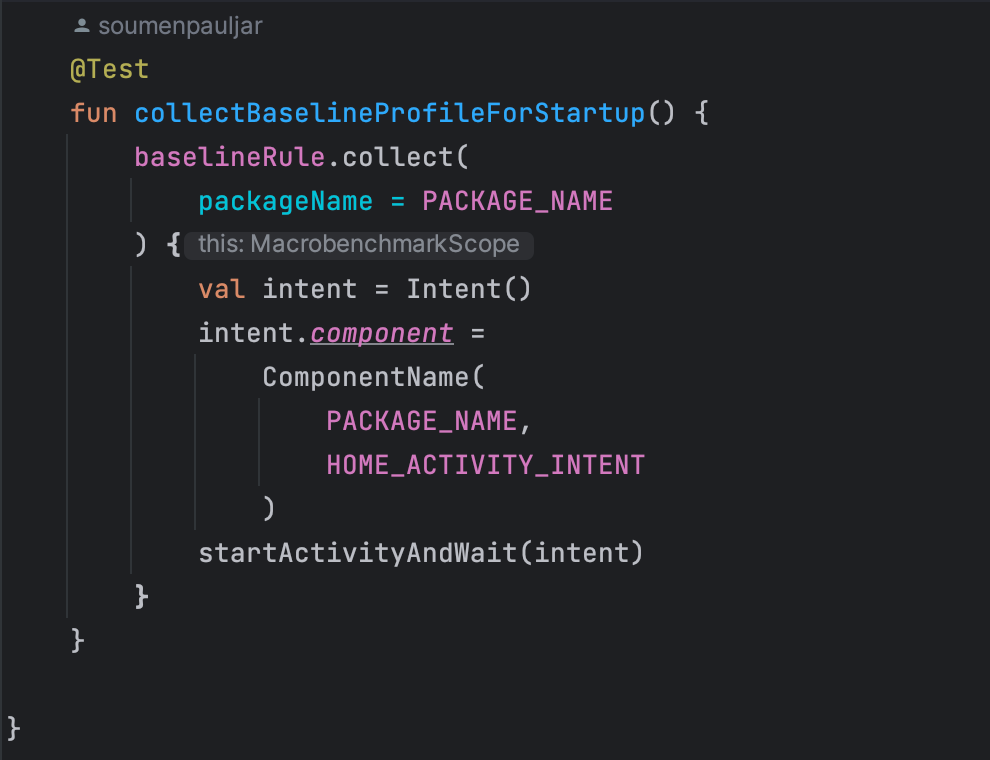
Below test generates the Baseline Profiles in a Human Readable text by running several iterations of App Startup and every startup will last until the first frame of Home Activity is drawn. After running this test we can view the Baseline Profile file by clicking the results
Place Contents in baseline-prof.txt in main directory of app module -
Copy the contents provided and paste them inside the baseline-prof.txt file located at App -> src -> main.
Ensure Baseline Profile in Release Build -
After building the release build of your application, verify that the baseline.prof file is present inside the assets folder of the generated APK. This ensures that the baseline profile is bundled with the application for reference.
How does the Baseline Profile generator work?
It basically compares the collected profile data of current iteration with previous iteration and keeps on doing it until the profile gets stable mean until it gets the correct bytecode instruction. We can also limit it by setting up the maxIterations parameter inside the test function.
Can we optimize it further? (DEX optimization)
Yes, We can. R8 compiler basically does the minification and obfuscation of all code and it compiles all the shrinked code into a single .dex file in the form of instructions.
We can enable the dexlayoutOptimization = true, baselineProfilerulesRewrite = true inside of the baselineProfile scope, and we need to add another parameter: includeStartupProfile = true, as it will indicate to the generator that this generation is specifically for the startup journey.
The code inside of this should look like:
android {
    baselineProfile {
        dexlayoutOptimization = true
        baselineProfilerulesRewrite = true
        includeStartupProfile = true
    }
}
In result it will segregate the single dex file into two files. One with inclusion of start up instructions and another with exclusion of startup instructions. So while starting the app it will only read the startup dex file which has already pre compiled startup instructions from a new startup profile file.
All About Benchmarking in App Performance
When it comes to understanding app performance, benchmarking plays a crucial role. There are two primary types: macrobenchmarks and microbenchmarks.
Macrobenchmarks measure overall app performance, simulating real-world usage scenarios such as app startup time, UI responsiveness, and scrolling speed in components like RecyclerView. They provide valuable insights into how the app feels during user interaction, helping us understand the user experience at a broader level.
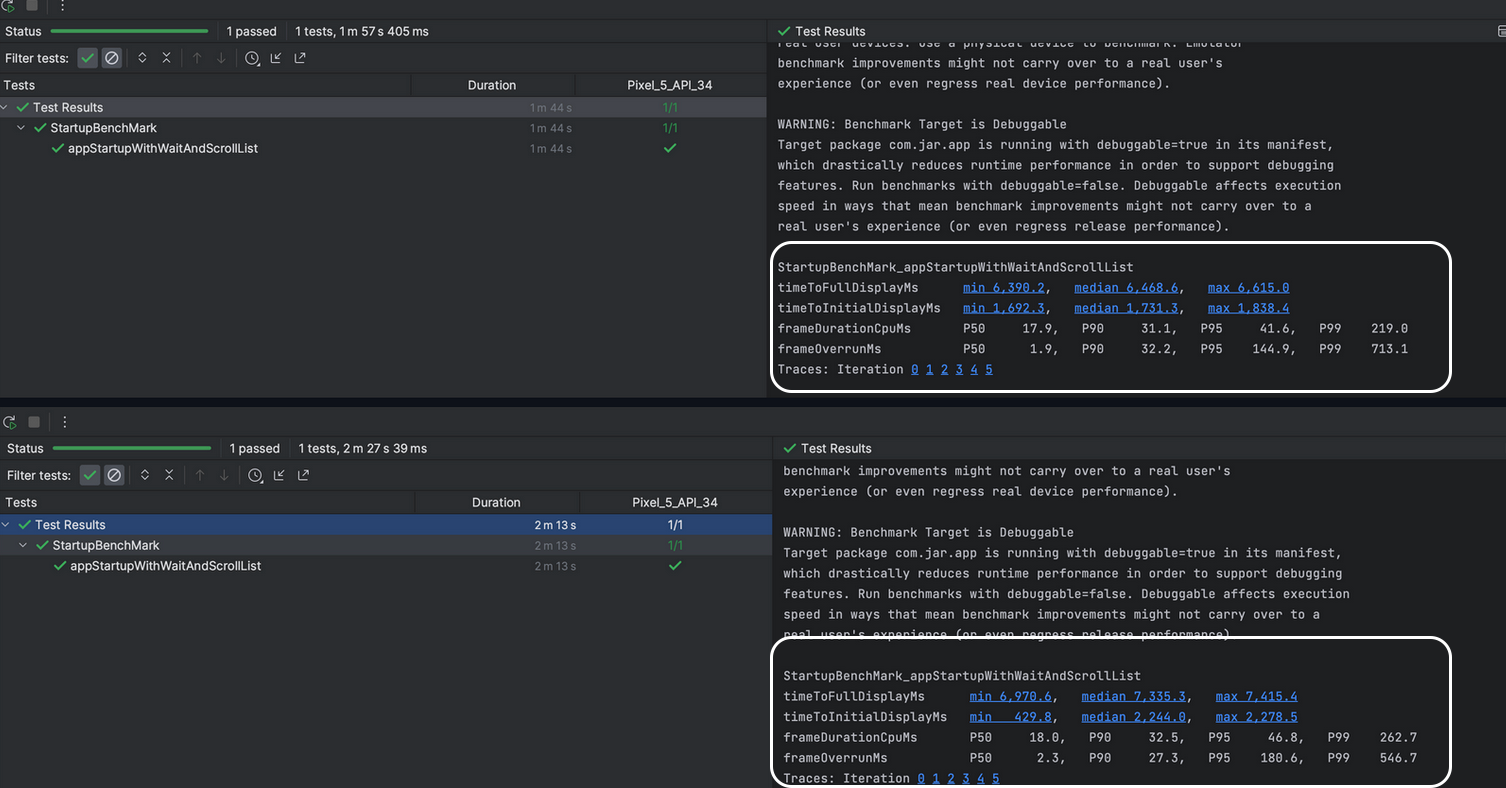
Through macrobenchmarking, we can capture many vital metrics, including startup time and frame metrics—some of the most critical indicators. These metrics give us insights into how our frames are functioning and can help identify potential janks during startup. For a deeper understanding of these metrics, refer to Capture Macrobenchmarks by Android.
We had also faced an issue detecting TTFD (Time to Full Display), for which we utilized the reportFullyDrawn() method as suggested by Android. This method was implemented inside the view creation method of the home fragment, allowing us to accurately measure when the app's UI is fully rendered. It’s crucial to write tests in such a way that they cover the point where we call this function; otherwise, TTFD won’t be captured effectively.On the other hand, Microbenchmarks focus on specific app components, measuring how quickly functions execute or how efficiently they operate. While crucial for granular performance optimization, they don't capture the full user experience. For instance, they can evaluate the execution time of frequently used "hot" functions warmed up by JIT, offering insights at the unit level.
During our macrobenchmarking process, we encountered the need to mock our onboarding flow for first-time, non-logged-in users. To achieve this, we created scripts using UI Automator to simulate the entire process effectively.
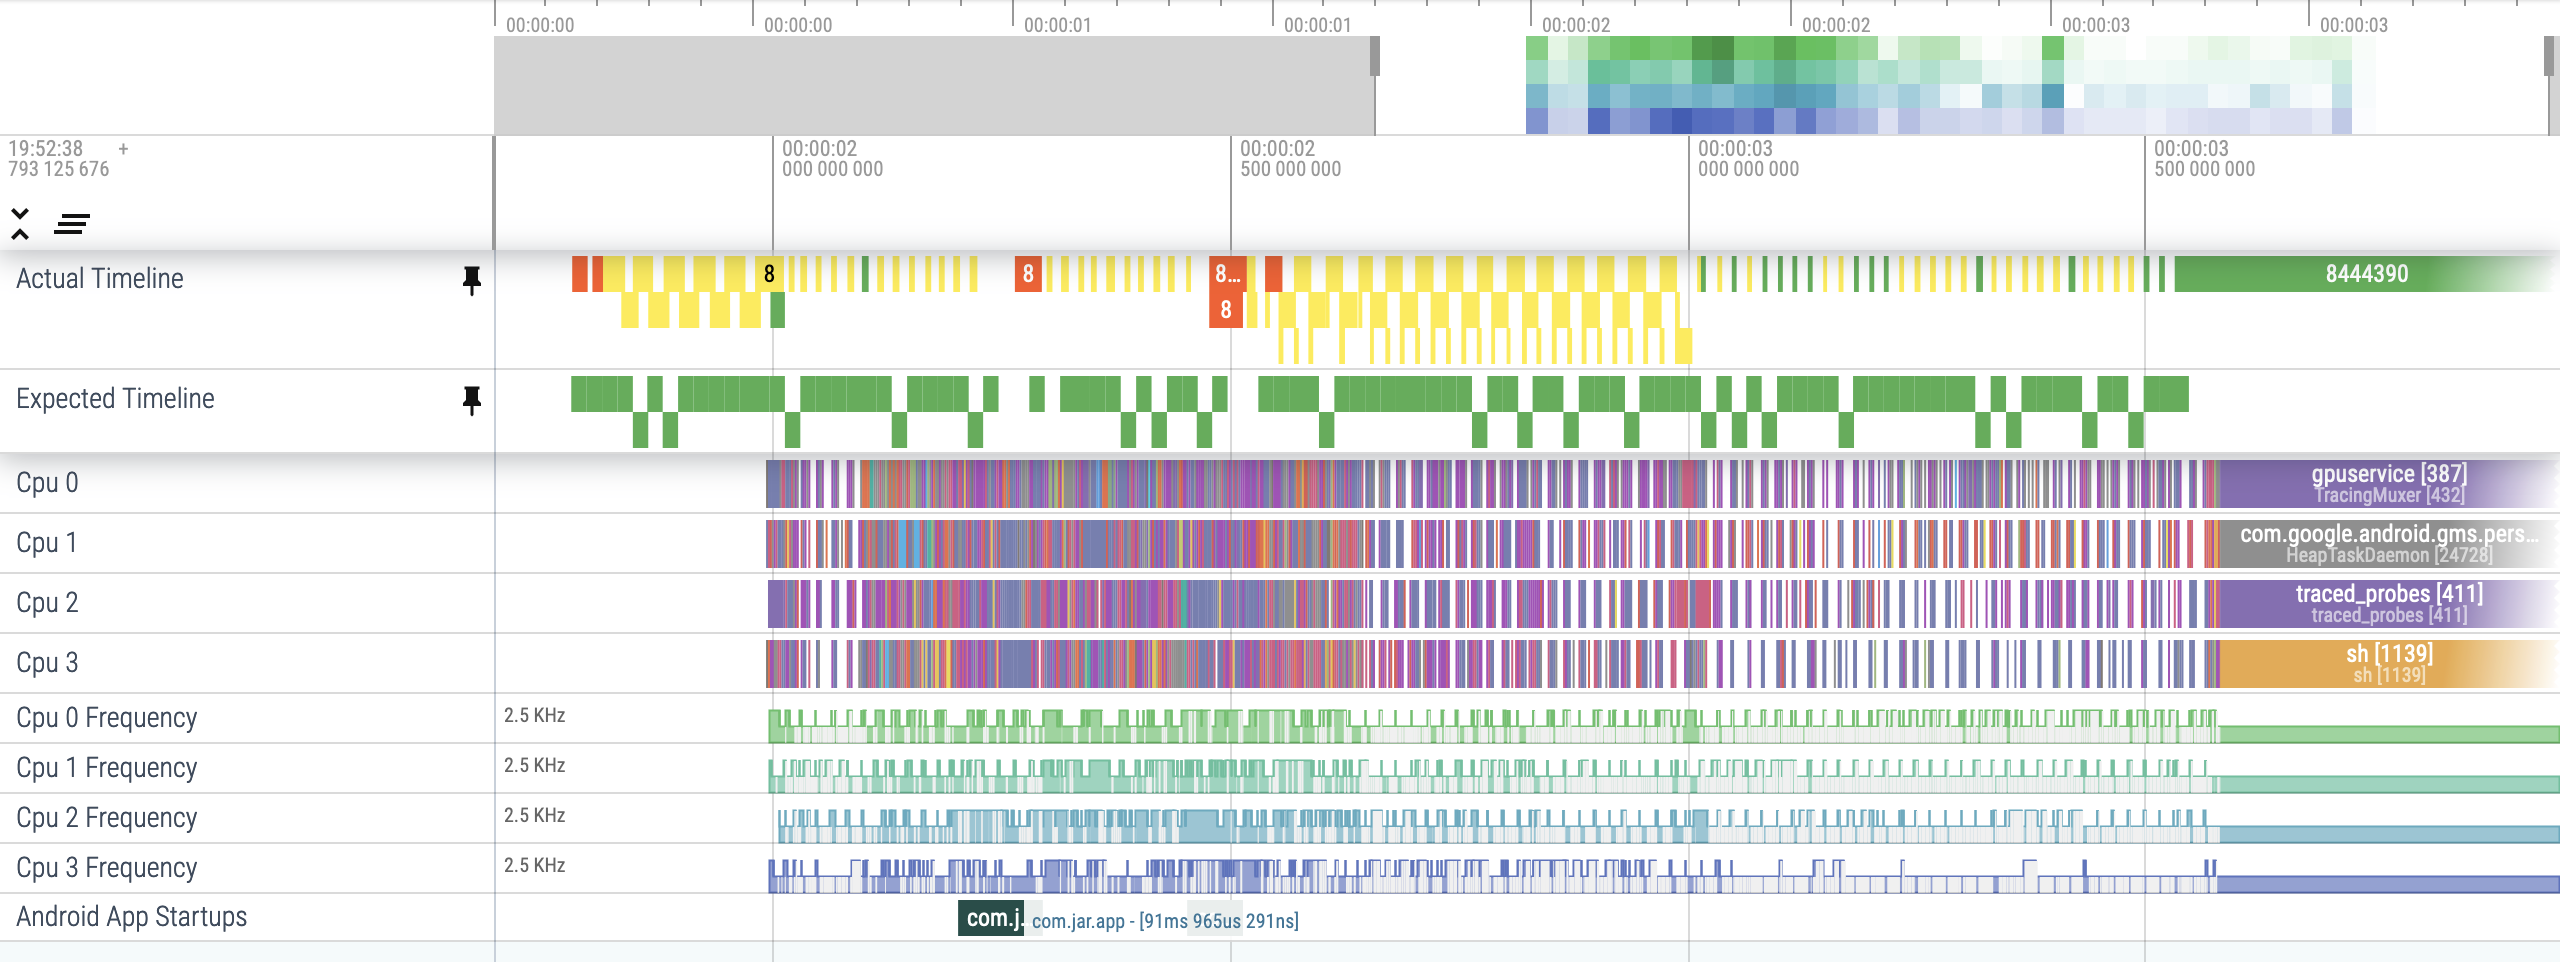
If your TTFD flow renders Compose components. Integrating composition tracing with macrobenchmarks allows you to see the expected and actual timelines of frames in Perfetto, facilitating more effective performance diagnosis.
-
Add the runtime-tracing dependency to your
:appmodule:implementation("androidx.compose.runtime:runtime-tracing:1.0.0-beta01") -
Add dependencies to the :measure module for Macrobenchmark:
implementation("androidx.tracing:tracing-perfetto:1.0.0")
implementation("androidx.tracing:tracing-perfetto-binary:1.0.0")
After running our macrobenchmark tests, we observed valuable results with complimentary trace. The trace files generated can be located at:
project_root/module/build/outputs/connected_android_test_additional_output/debugAndroidTest/connected/device_id/
These trace files can then be uploaded directly to the Perfetto UI tool for detailed analysis.
Final showdown for Baseline Profiles
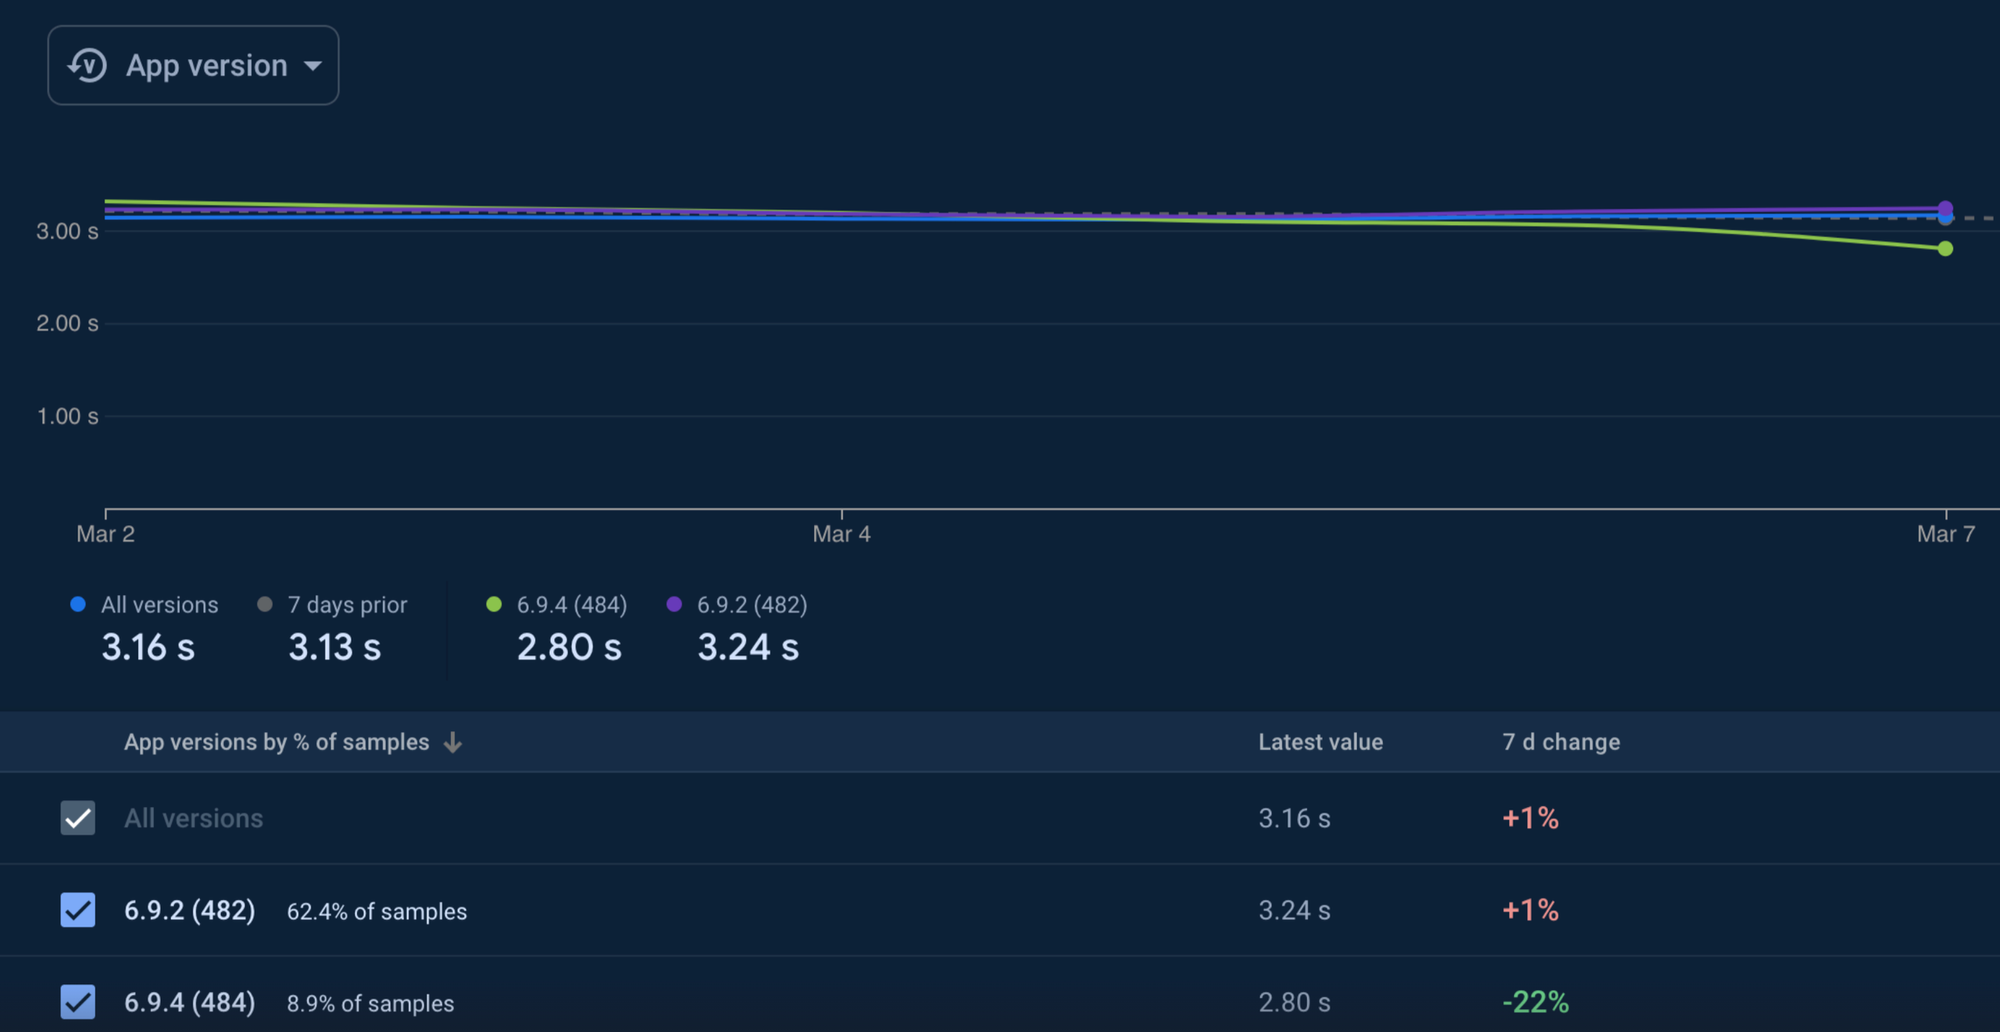
We have observed approx 15% straight reduction in our app startup overheads after implementing Baseline Profiles with DEX optimization.
Tracking through Firebase custom traces
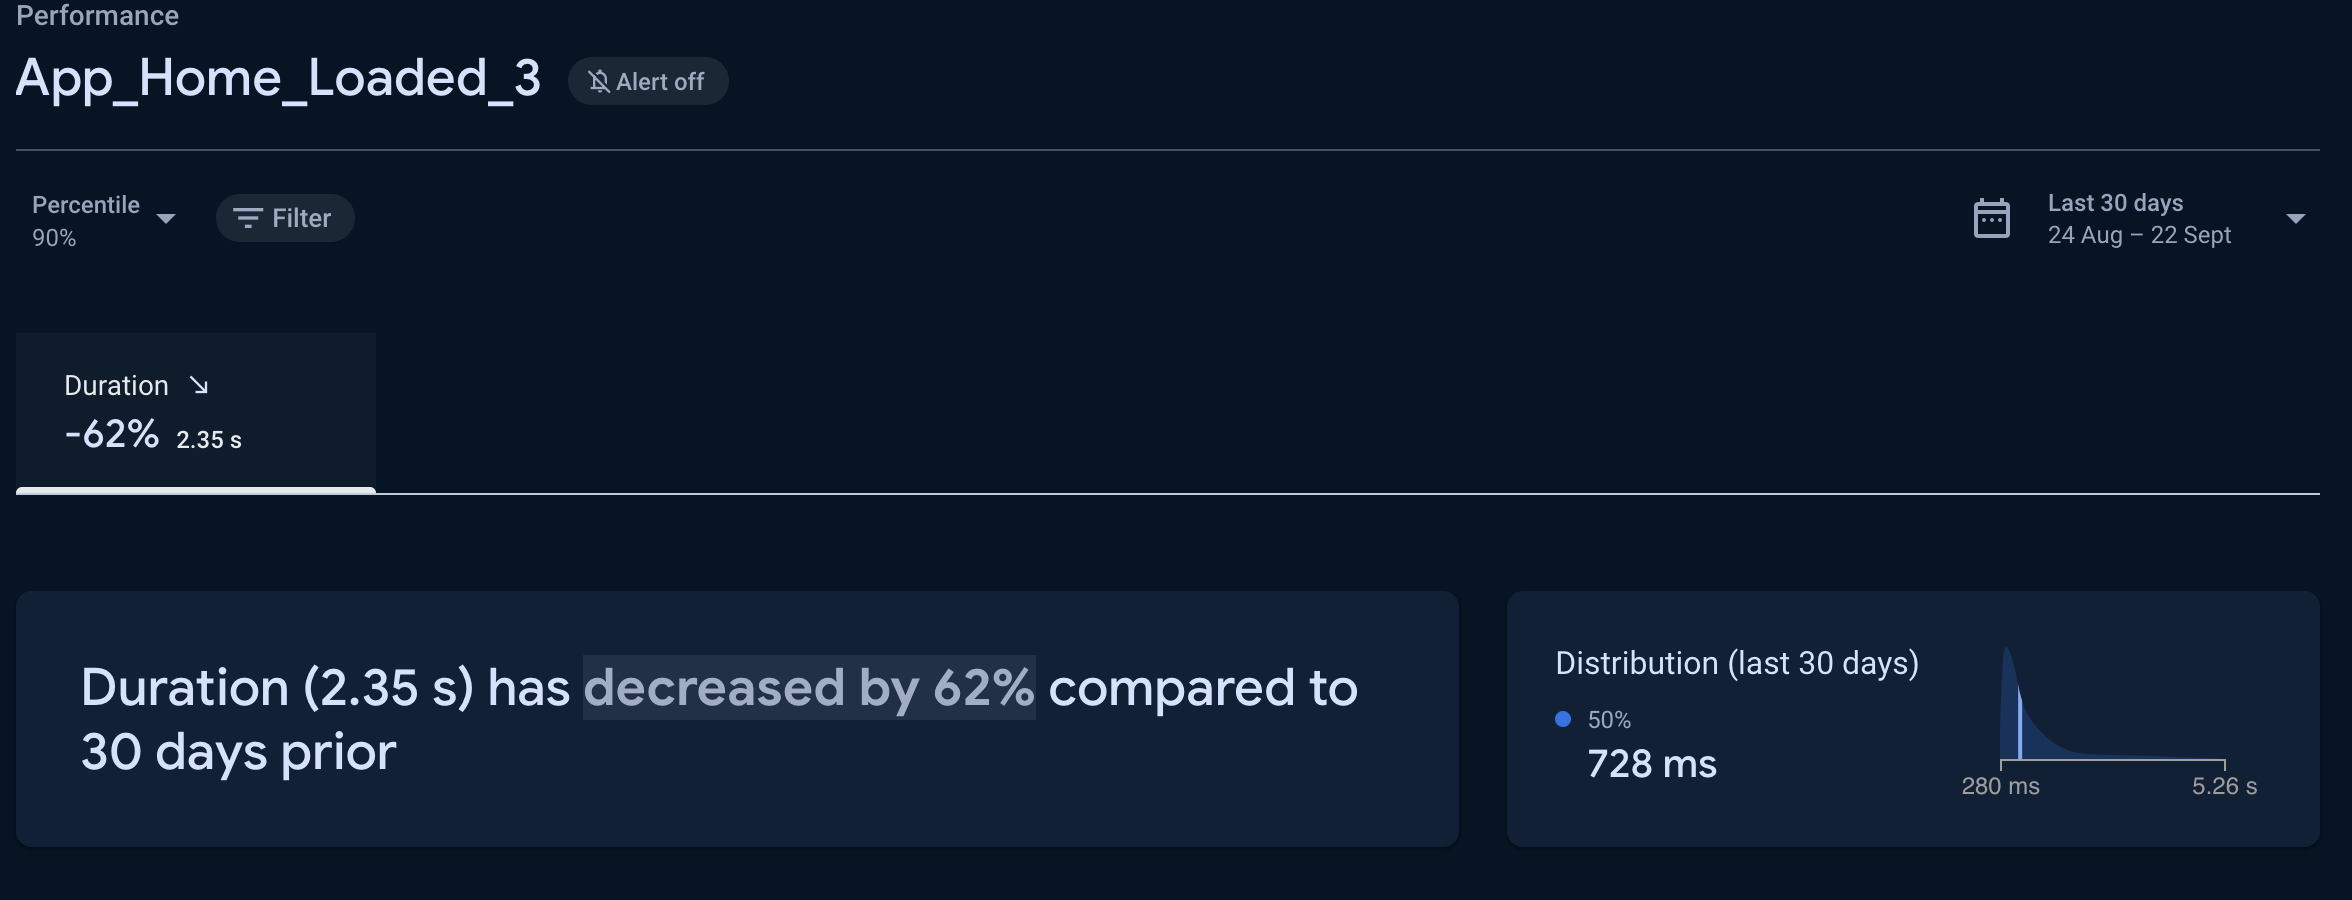
After implementing baseline profiles and thoroughly analyzing our app’s performance with benchmarking, we realized that to truly understand user experience, we needed real-time data. This insight led us to focus on two critical metrics within our startup flow:
- Home_Loaded: This measures the time taken to load the Home fragment, helping us pinpoint any delays in rendering the Home screen.
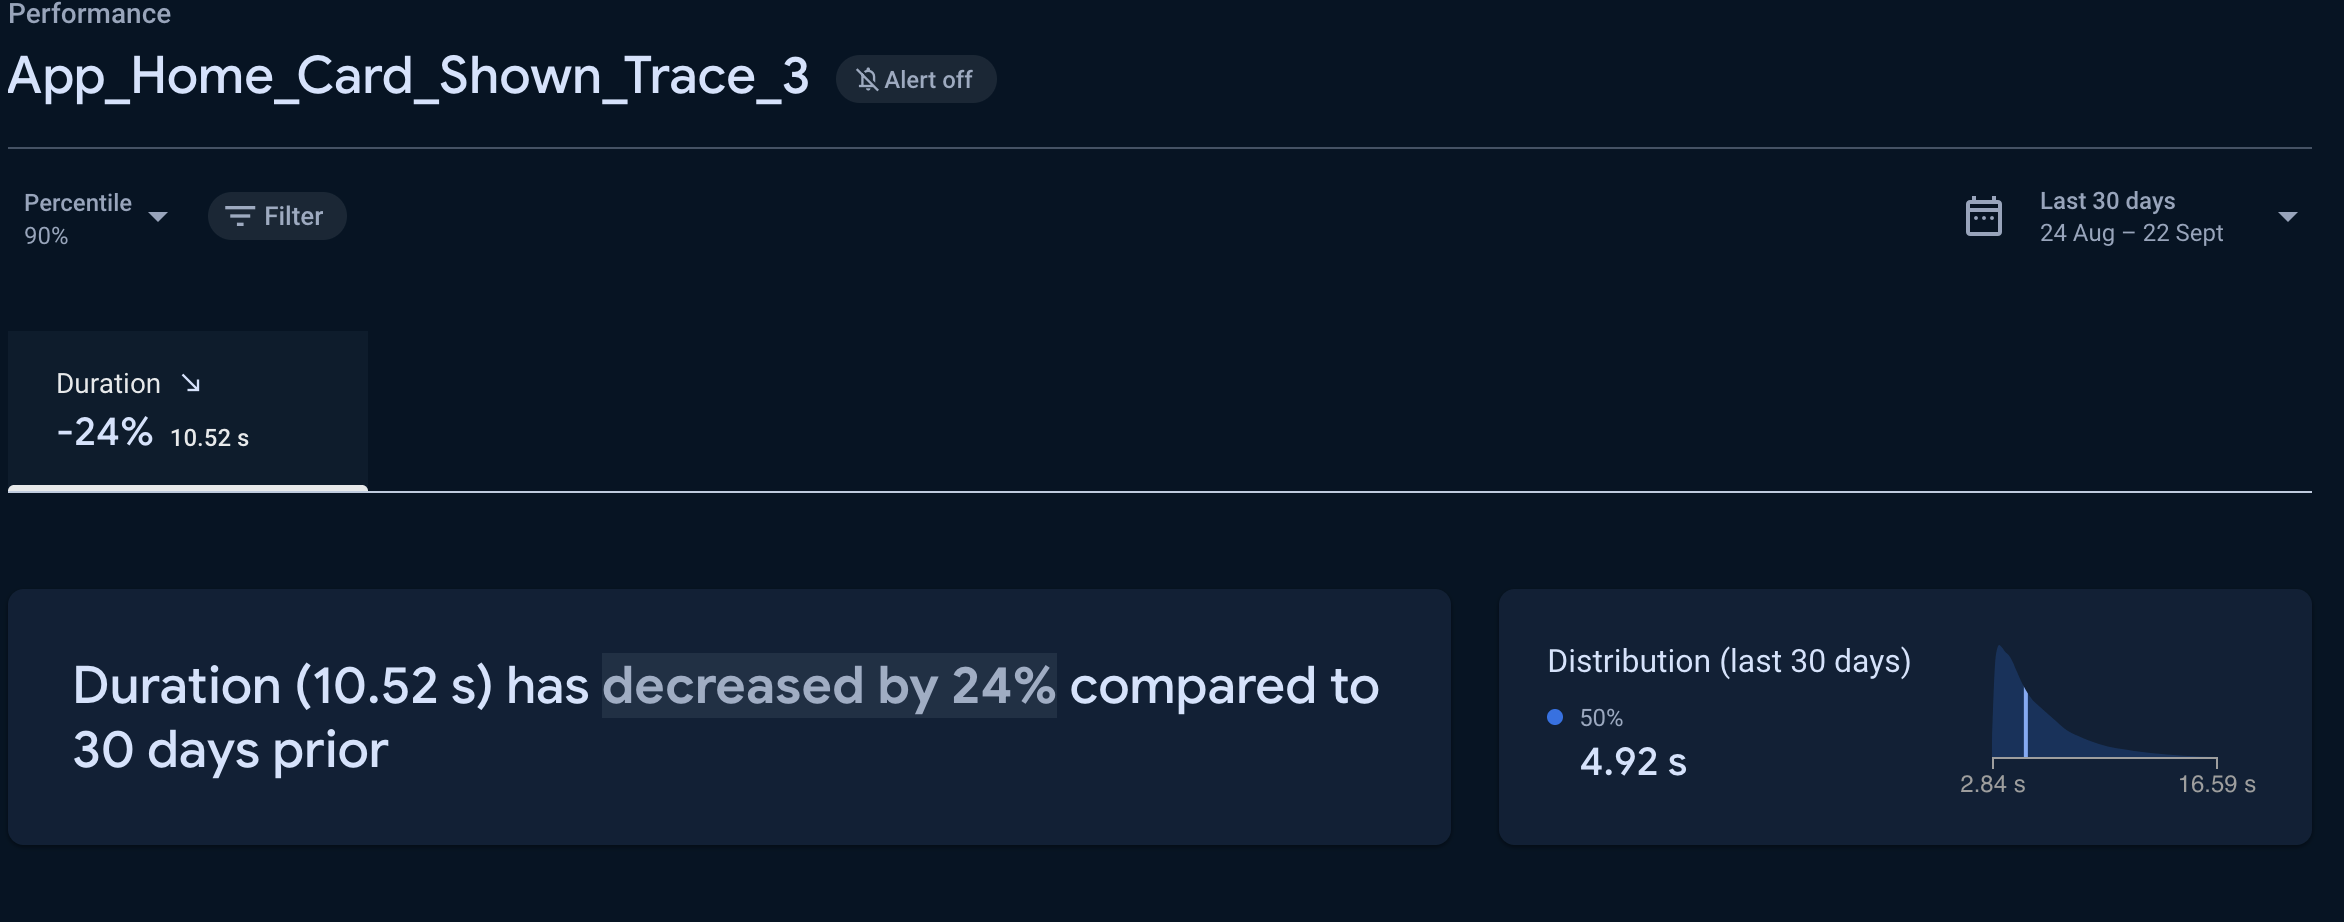
- App_Home_Card_Shown_Trace: This tracks the time until the first card in the Home fragment becomes visible.
By using Firebase Custom Traces, we can gain detailed insights into these specific areas, enabling us to optimize performance and ensure a smoother experience for our users. Additionally, we have added custom attributes to our traces to further nest metrics based on different splash variants, enhancing our understanding of user interactions and performance.
This approach allows us to capture the nuances of our app's performance, making it easier to implement effective improvements based on real user data.
Efficiently Tracking Activity and Fragment Metrics with Metrics Manager in Android
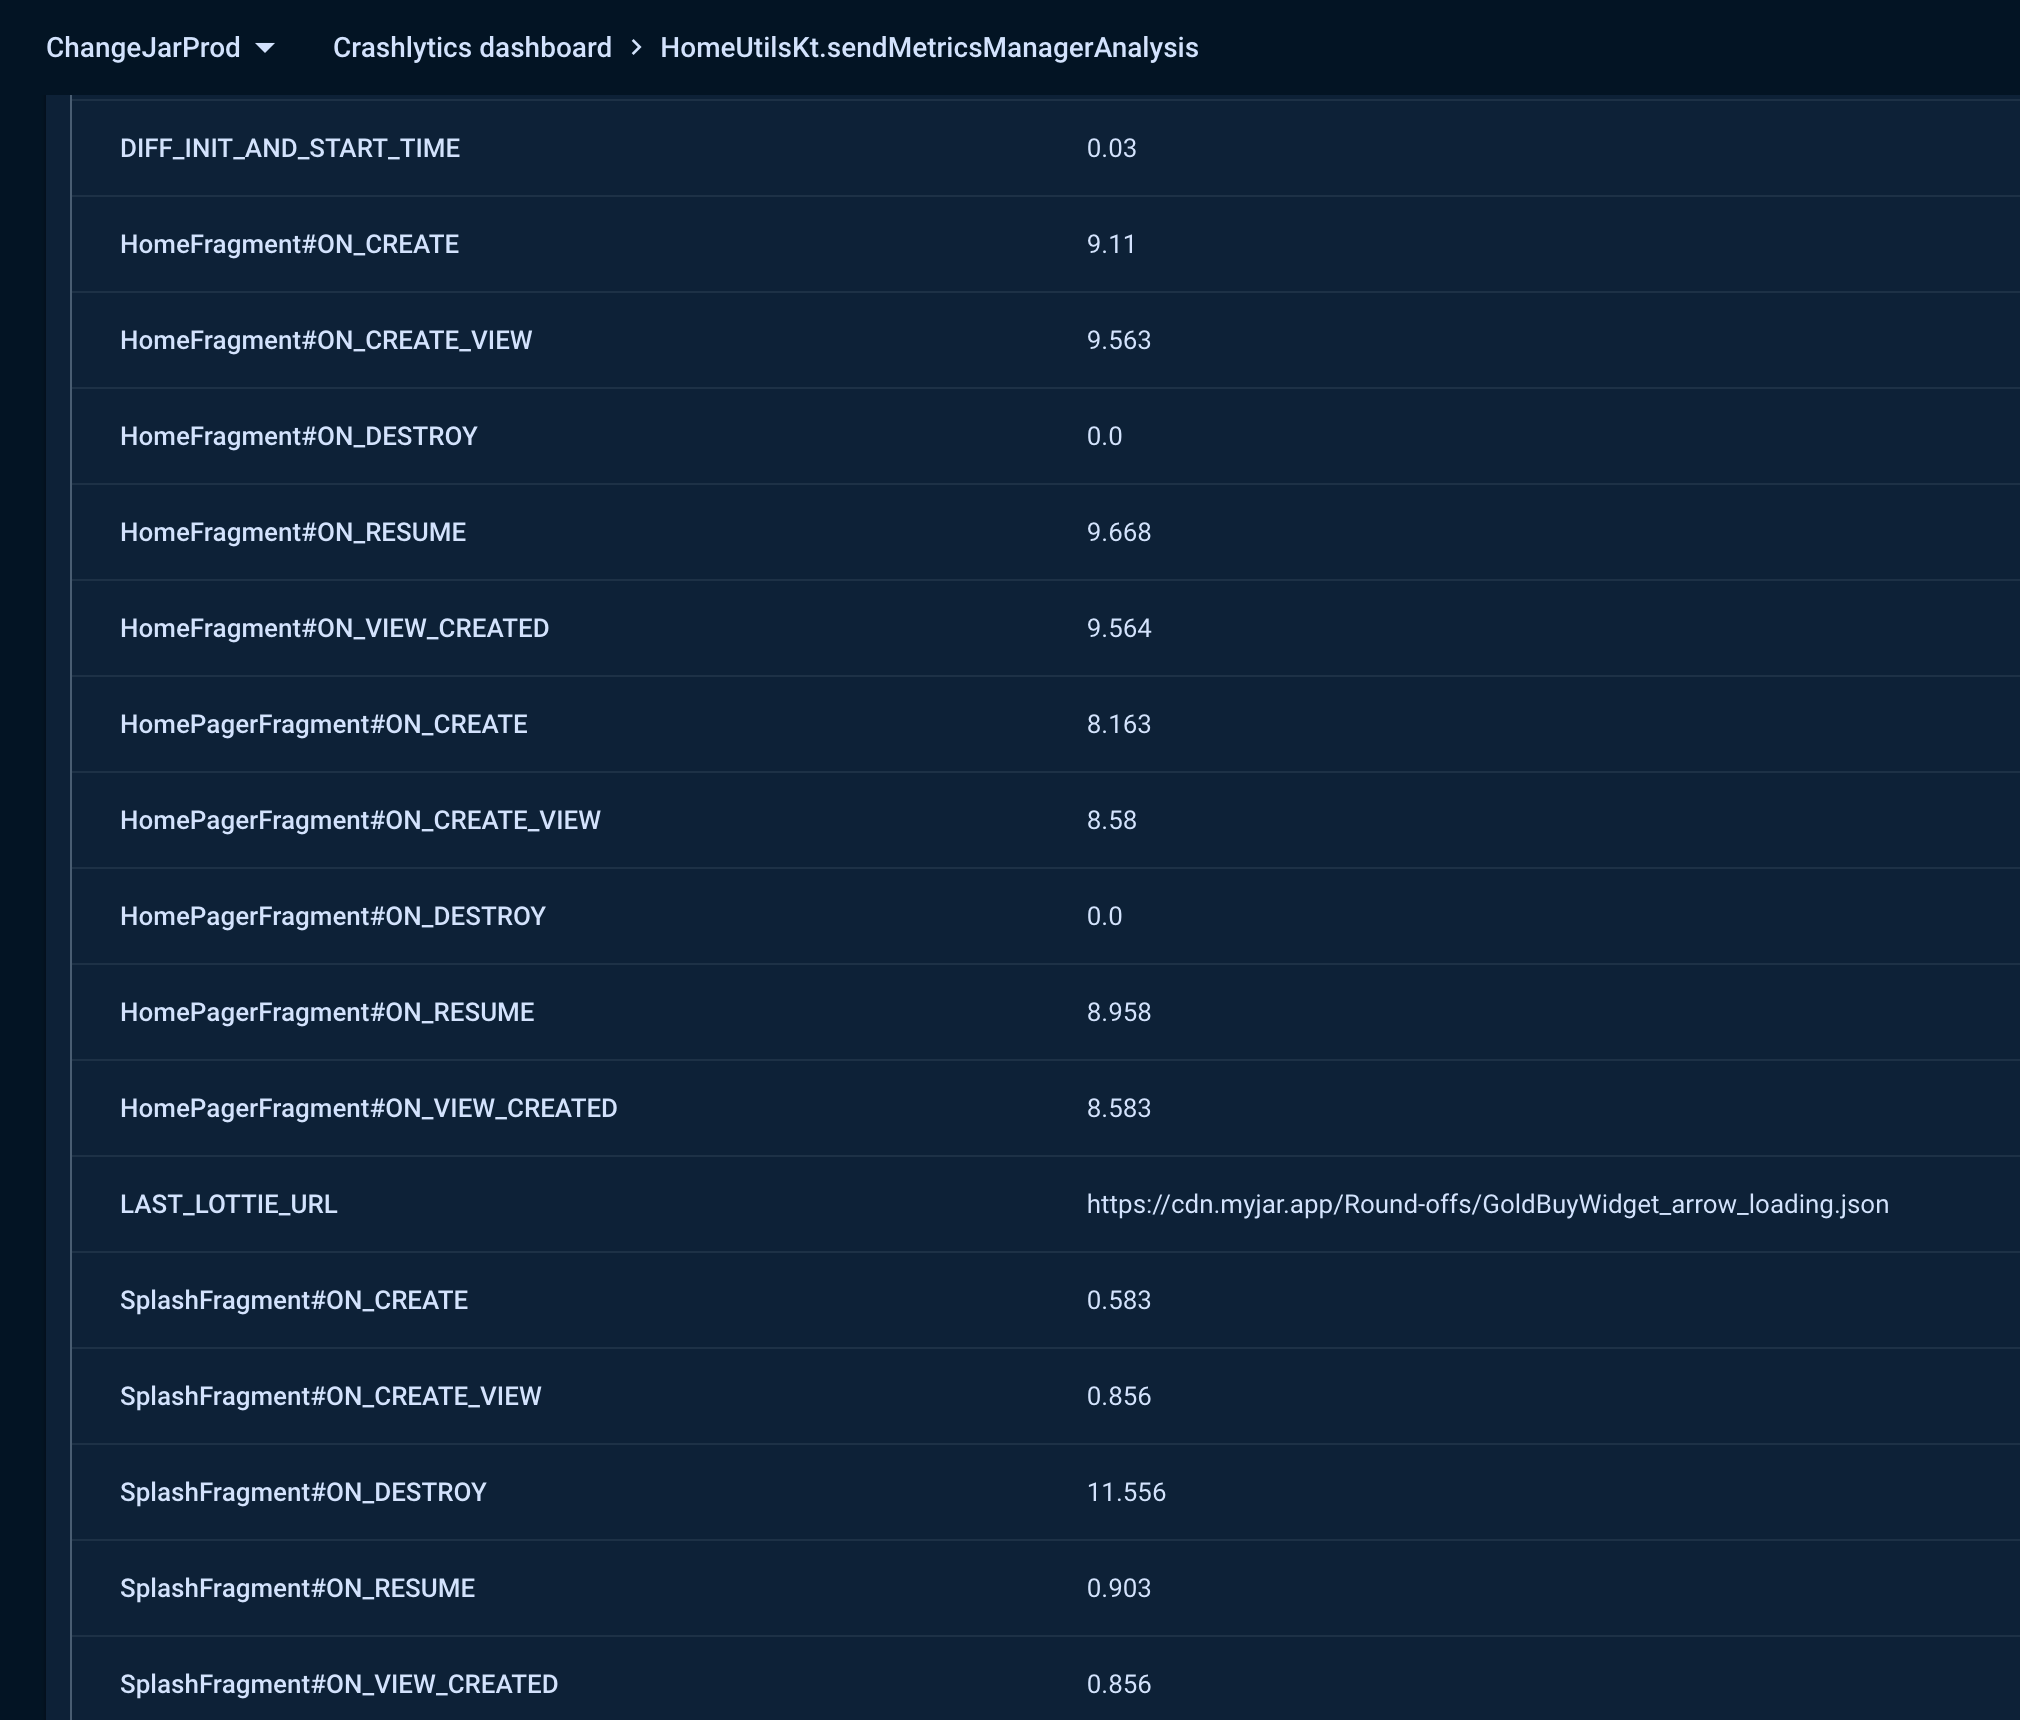
After detecting real-time data for the Home_Loaded and First_Card_Shown metrics, we wanted to dig deeper to identify the roots of any bottlenecks. To achieve this, we had to set up a system to distinguish whether delays were caused by UI rendering, data fetching, or other parts of the fragment's lifecycle.
Analyzing the lifecycle methods of fragments and activities offers valuable insights into where time is being spent, helping us pinpoint and address potential bottlenecks. For this purpose, we decided to develop MetricsManager, which enables developers to efficiently manage and retrieve timing metrics for both activities and fragments.
Implementing Metrics Tracking in Fragments/Activities
To track the breakdown of lifecycle methods in a fragment/activity, you can invoke the measureMetrics(true, metricsManager) method. This call effectively instructs the base fragment/activity to begin monitoring the performance metrics of the respective fragment’s lifecycle events, providing valuable insights into execution times for analysis.
The MetricsManager class is designed to facilitate this tracking:
class MetricsManager { ... }fun addActivityMetrics(activityMetrics: ActivityMetrics) { ... }fun getActivityMetrics(activityName: String): ActivityMetrics? { ... }fun removeFragmentMetrics(fragmentMetrics: FragmentMetrics) { ... }fun addFragmentMetrics(fragmentMetrics: FragmentMetrics) { ... }fun getFragmentMetrics(fragmentName: String): FragmentMetrics? { ... }fun getActivityMetricsList(): List<ActivityMetrics> { ... }fun getFragmentMetricsList(): List<FragmentMetrics> { ... }
With this MetricsManager, you can efficiently add, retrieve, and manage metrics for both activities and fragments, enabling a comprehensive analysis of performance across your app.
Throwing Non fatal Firebase Exception on exceeding vital threshold limits of loading Home Cards
We have added these metrics as custom keys for firebase non fatal exceptions, so we can see them over on non fatal Crashlytics dashboard with their device ID for further debugging.
How It Works
- Collect Metrics: Capture data on various app performance aspects.
- Retrieve Metrics: Use MetricsManager to access detailed metrics.
- Check Thresholds: Compare metrics against predefined limits.
- Report Issues: Send a non-fatal Firebase exception if thresholds are exceeded.
This approach ensures that critical performance metrics are closely monitored and any potential issues are swiftly addressed.
Jar App Optimization (Reduced 300ms approx)
To further enhance app performance and minimize overhead on the main thread, we optimized the initialization process by offloading setup tasks to a background thread using a single pool executor. By moving the initialization of various third-party services off the main thread, we achieved a significant reduction in main thread overhead—approximately 250ms.
This adjustment led to a smoother and more responsive startup experience for our Jar App. Before implementing this optimization, the onCreate method of our Application class took around 330ms; after optimization, this time has been reduced to just 60-70ms. This strategy effectively reduced our initialization process, contributing to faster load times and improved overall performance.
Pre-parsing the splash Lottie animation (Reduced 400ms)
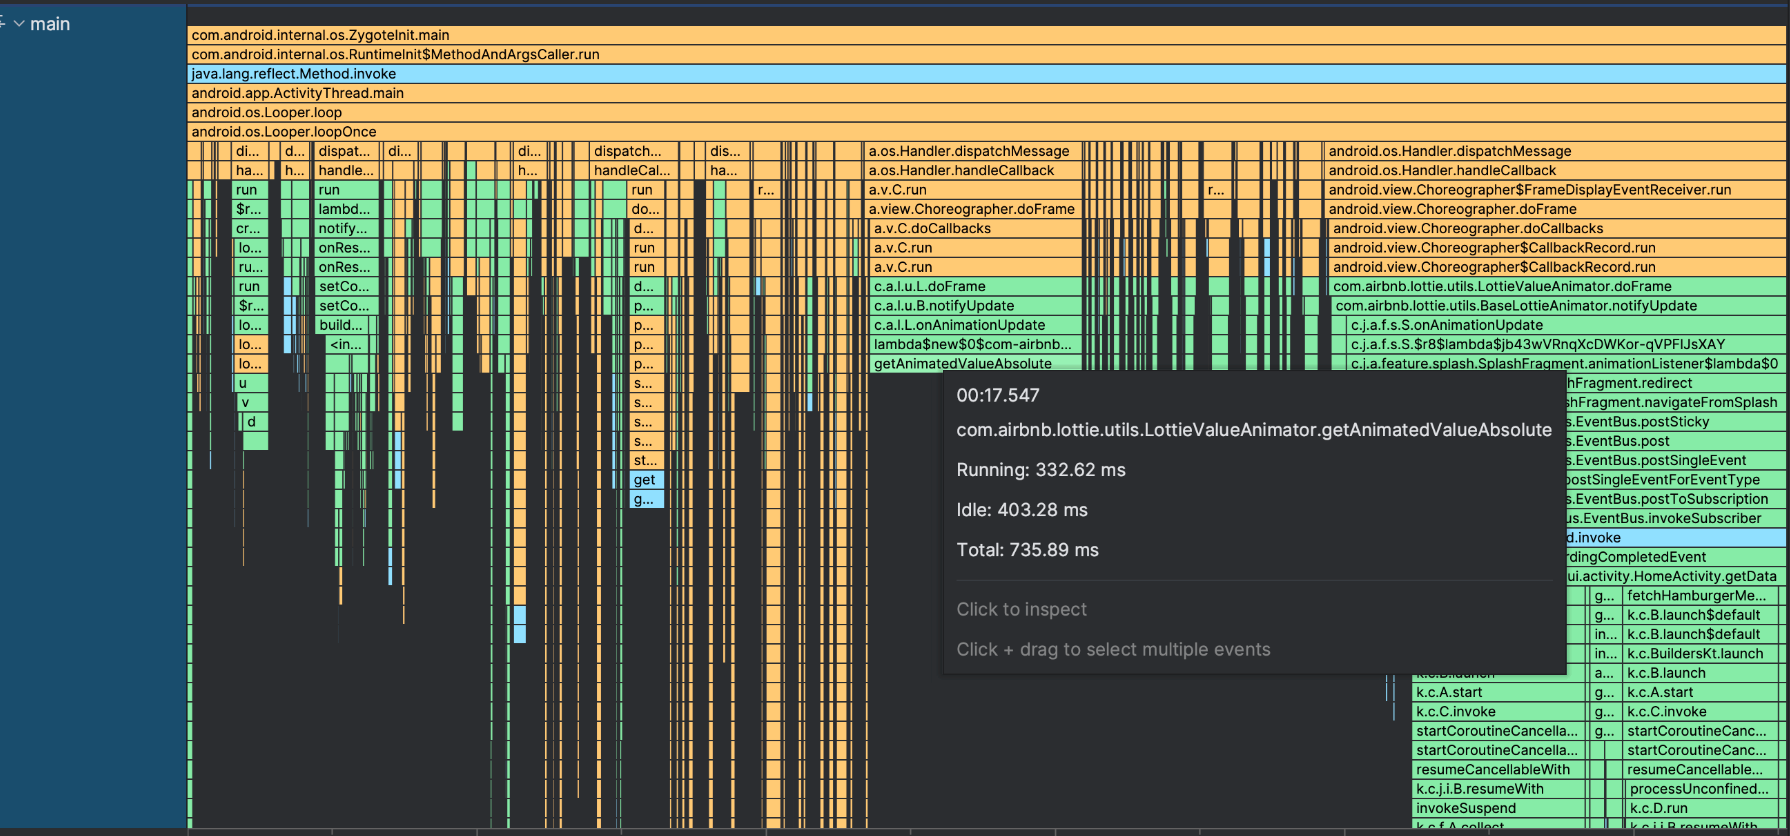
We spent time analyzing Java and Kotlin traces, which revealed that the Lottie animator was taking good amount of time to be executed. Pre-parsing the splash Lottie animation has proven to be highly beneficial, saving us approximately 400 milliseconds. By initializing the Lottie composition in the background by using the LottieCompositionFactory. we offload the parsing task to a separate thread.
Pre Fetch Home data in Splash (Reduced 700ms approx)
To optimize startup performance, we’ve shifted from fetching API responses during Home Fragment loading to prefetching them during the Splash screen. Previously, data was retrieved from endpoints as soon as Home Fragment began loading, which added significant overhead. By migrating this process to the Splash screen for logged-in users, we’ve effectively reduced startup overhead by approximately 700 milliseconds. This adjustment ensures that data is ready and available by the time the user reaches the Home screen, resulting in a smoother and faster app experience.
Leveraging Async Epoxy Controller to build our home epoxy models (Reduced janks by 65%)
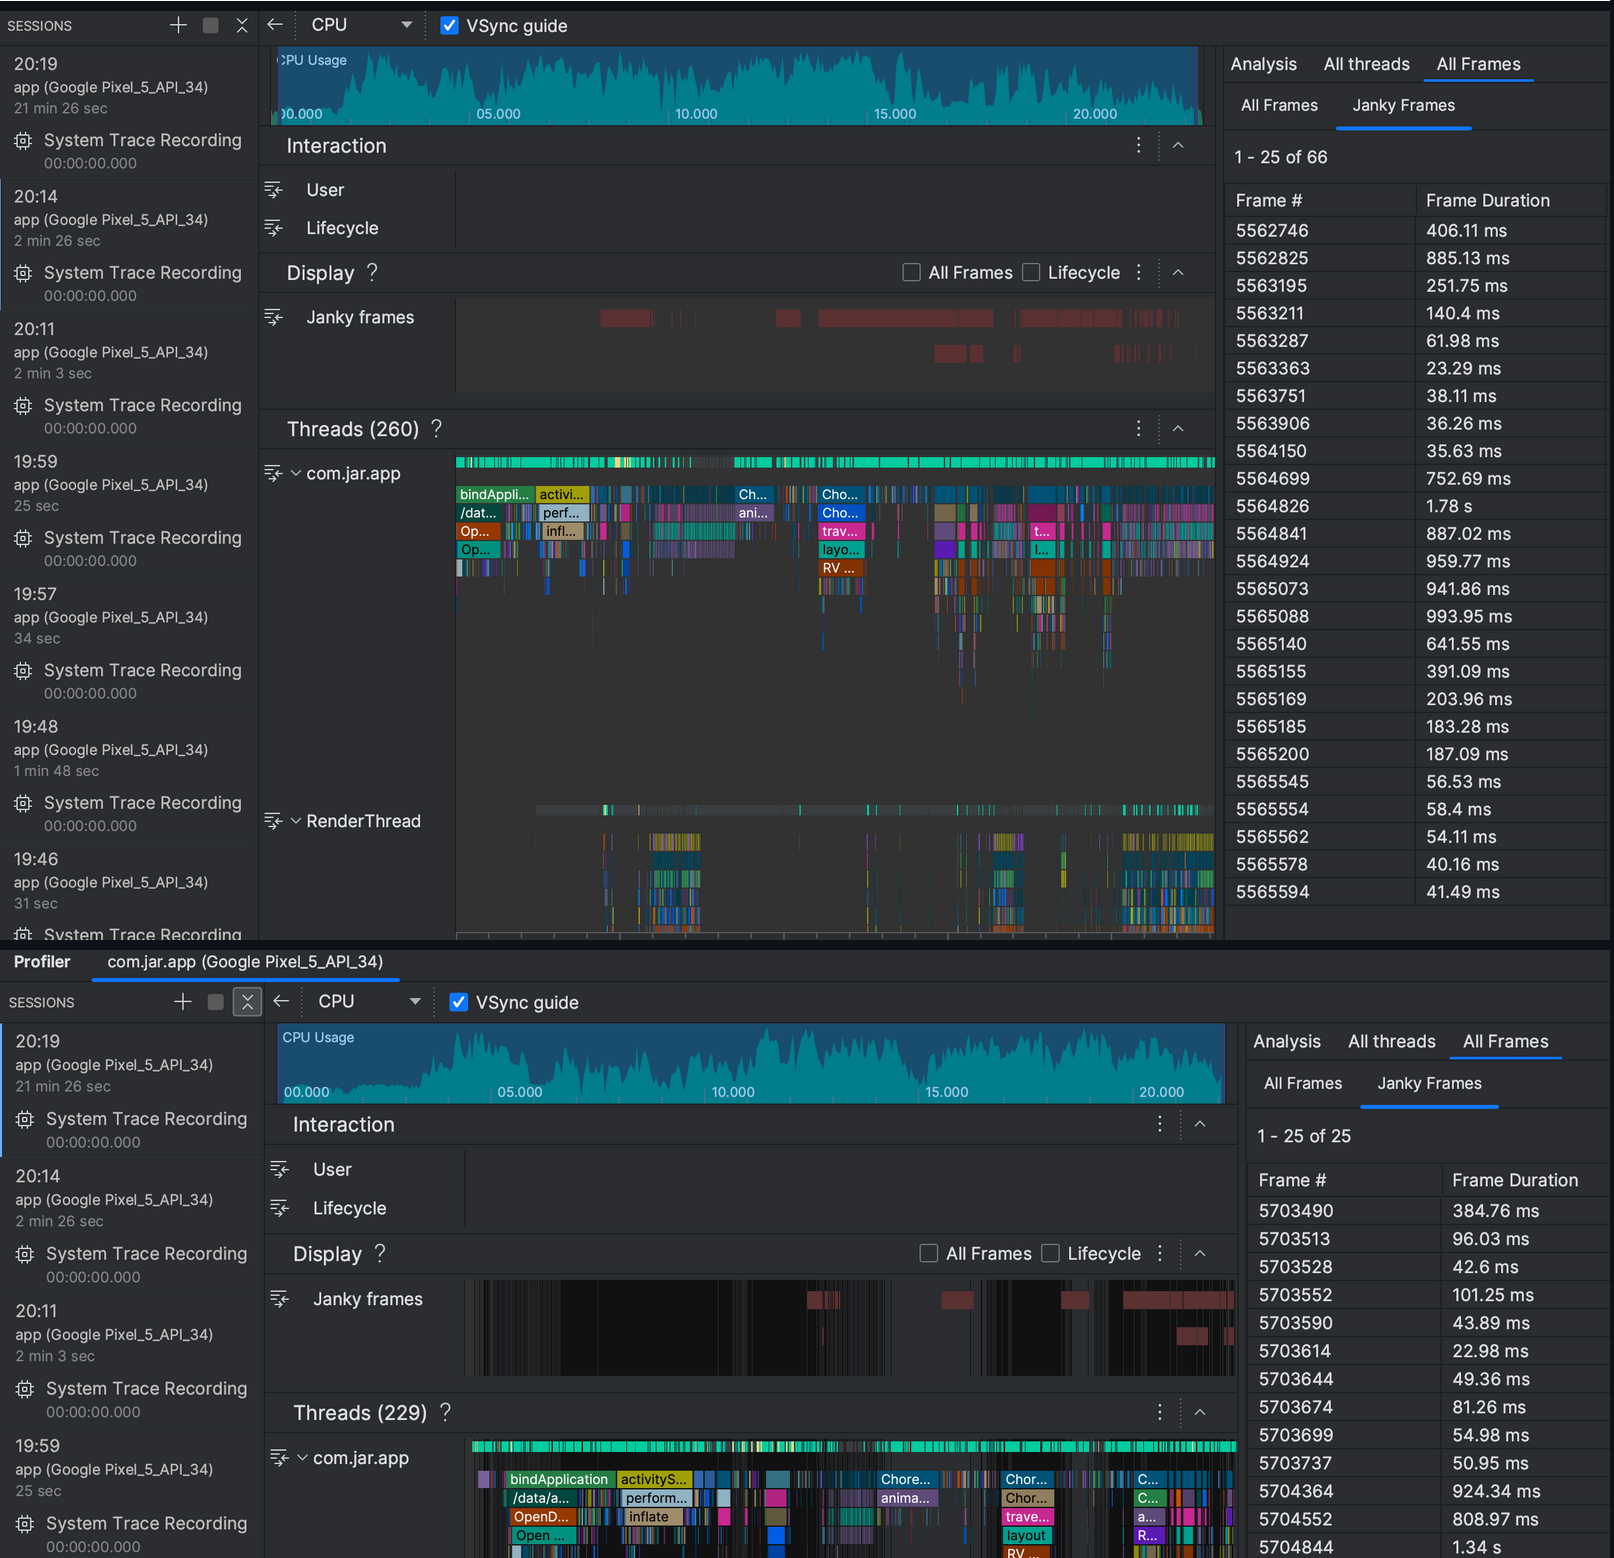
To create a smooth and streamlined startup flow, we focused on minimizing jank, recognizing that janky frames could hinder user experience. To address this, we utilized Android's System Trace to identify performance issues.
As part of our optimization efforts, we abstracted the model-building logic of Epoxy models into a separate utility class. This change enables us to distinguish between asynchronous and standard Epoxy controllers based on remote configurations, enhancing overall efficiency and responsiveness in our app.
Impact on Performance
- With EpoxyController: Approximately 66 janky frames
- With AsyncEpoxyController: Approximately 25 janky frames
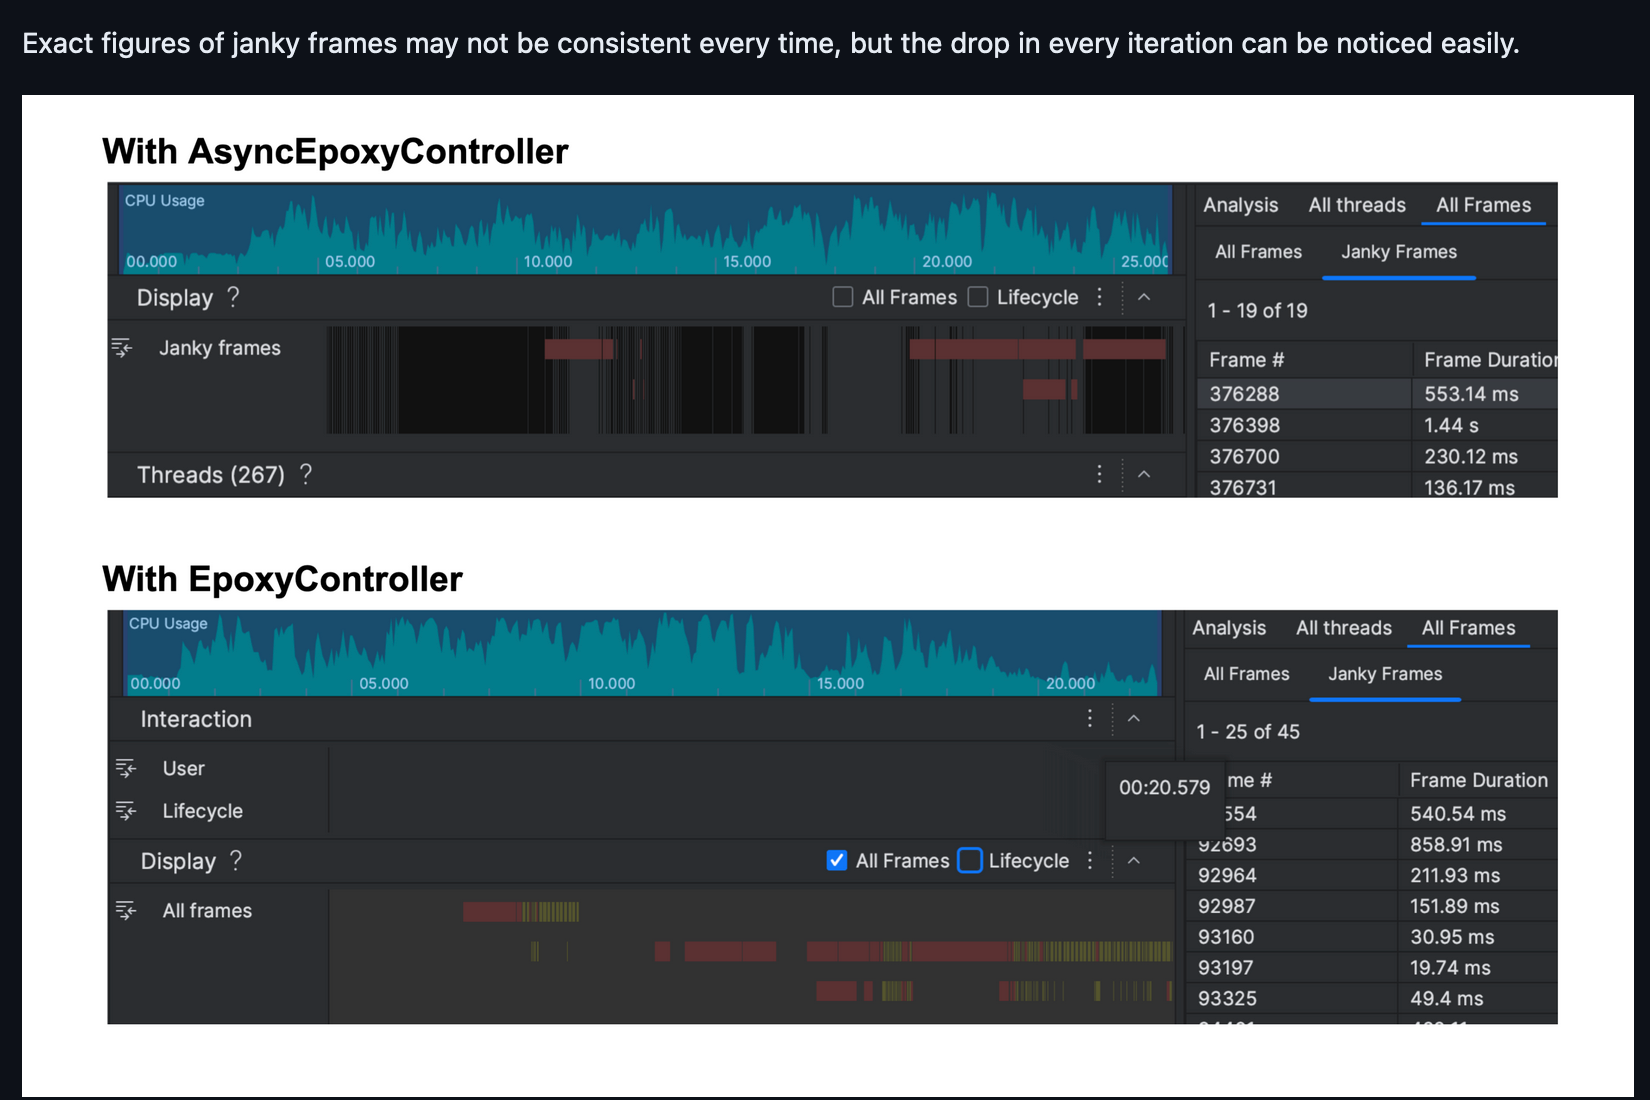
While exact figures for janky frames may vary, the noticeable reduction in every iteration highlights a significant performance improvement. By leveraging this abstraction, we ensure smoother and more responsive UI interactions.
This adjustment ensures that the main thread remains unobstructed, leading to smoother and more responsive UI interactions.
Understanding and Mitigating Jank in UI Rendering (Calculating freezing time)
In a typical 60Hz display, the screen refreshes 60 times per second, which means the Choreographer aims to redraw a frame every 16.67ms. If the rendering of a frame exceeds this threshold, jank occurs, resulting in a noticeable drop in UI smoothness.
Note: Firebase currently tracks only slow frames (greater than 16ms) and frozen frames (greater than 700ms), making it insufficient for our needs.
Traditionally, we’ve tracked jank occurrences by counting frames that exceed 16.67ms. However, this method doesn’t adequately reflect the severity of performance degradation. For example, a single jank with a 500ms frame time is far more disruptive than five janks of 20ms each, yet both scenarios might be recorded similarly in our metrics.
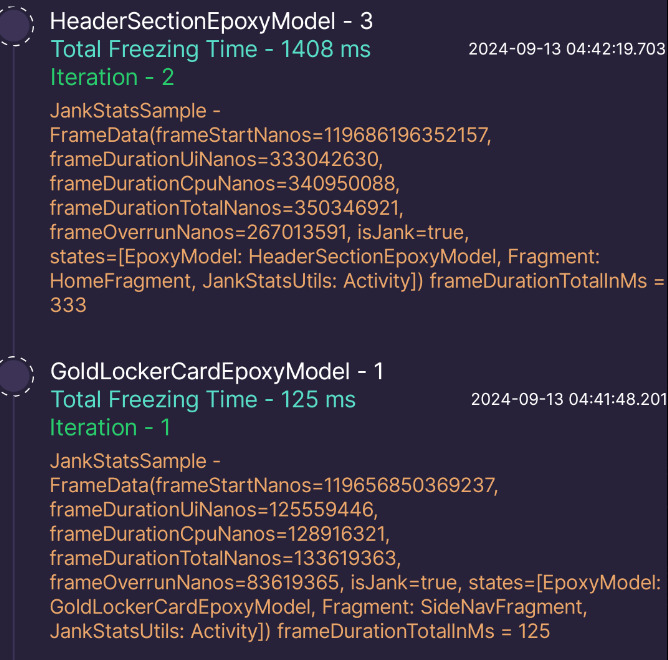
To bridge this gap, we introduced a new metric: Freezing Time. This metric captures the additional time taken by a frame beyond the 16.67ms threshold, offering a clearer understanding of the actual impact on user experience. By tracking Freezing Time, we can more effectively assess and address performance issues in both fragments and Epoxy Models.
We implemented this by creating util wrapper over Android's JankStats, enabling us to monitor all janks which are being produced.
Reducing Startup Freezing Time by Offloading Shimmer and Lottie Rendering to Custom JarViewStub (2000-2500ms to ~1300-1500ms)
In our ongoing effort to optimize the performance of our app, particularly during the critical startup phase, we took advantage of deep diving into frame rendering and freezing time across various Epoxy models and fragments as stated above. Upon closer inspection, we identified performance spikes related to the rendering of Facebook's Shimmer and Lottie animations. These elements were contributing significantly to freezing times, pushing startup delays between 2000-2500ms.
To tackle this, we developed a custom solution—JarViewStub, which acts as a FrameLayout and supports both synchronous and asynchronous layout inflation. By leveraging JarAsyncLayoutInflator, which internally utilizes Android's native AsyncLayoutInflator, we created a system that offloads the rendering of Shimmer and Lottie animations from the main UI thread, reducing the pressure on the app during startup.
The key optimizations include:
- JarViewStub: Acts as a flexible FrameLayout with dual inflation modes (async and sync) that adjusts based on the complexity of the layout being inflated.
- JarAsyncLayoutInflator: Extends Android's
AsyncLayoutInflatorto handle the more complex UI elements asynchronously, ensuring smoother frame rendering during startup.
By migrating the rendering process for Shimmer and Lottie into these optimized components, we drastically reduced the startup freezing time from 2000-2500ms to around 1300-1500ms.
Additionally, We’ve developed Jar’s Dev Tools to track crashes, ANRs, and memory leaks using LeakCanary, while also monitoring janks and freezing times for each Epoxy model and fragment with JankStats. This allows us to maintain app stability while swiftly implementing new features. We’ll share more insights into our performance optimization strategies in future blogs, as we’re not done yet and still have a long way to go. Until then, keep filling your digital piggy bank with Jar👋
